Following a 3-month certification process, I am excited to announce that I have earned the State Assessment Data Credential. This process included a full-day training session followed by six online learning modules and was capped by an analysis project for a district.
In order to earn this credential, we spent quite a bit of time analyzing state data with respect to individual standards and items. To make this analysis as easy as possible, and to make it scalable, I used a combination of R, Google BigQuery, and Looker Studio.
R To The Rescue!
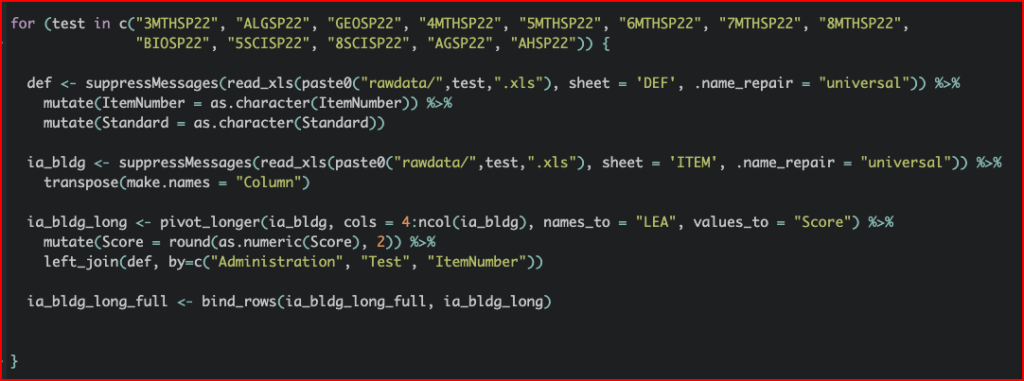
Rather than resort to simple cut/paste operations, and in order to make my analysis more scalable to other school districts, I programmed all of my “data wrangling” in R. Below is a short snippet of code used to build the Item Analysis data set:

Google BigQuery
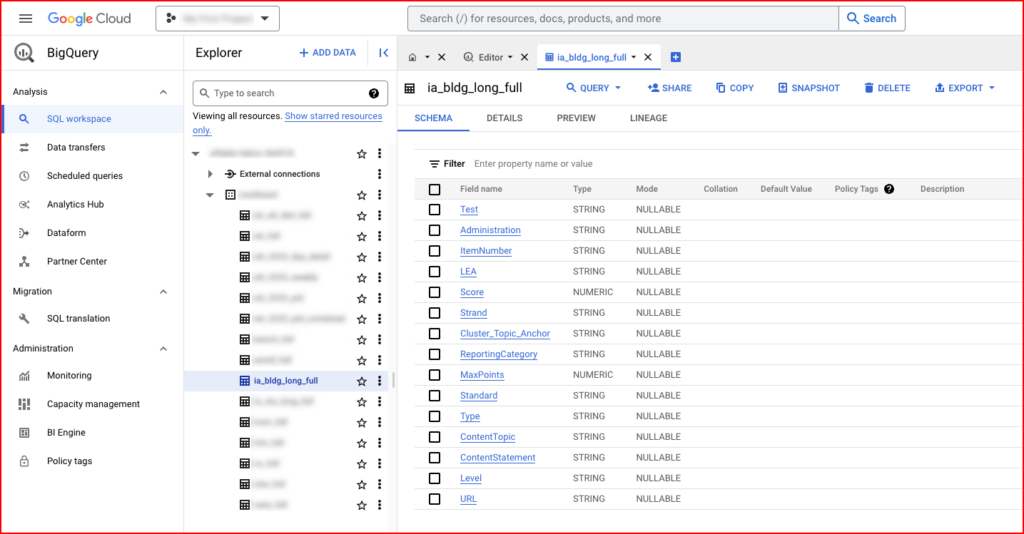
Once all of the data sets were extracted, cleaned, and aggregated, it was time to load them into a datawarehouse. Google BigQuery is an extremely fast, robust, powerful, and amazingly affordable solution for school districts, particularly those that use Google for other items such as Email, Calendar, and File Sharing. Below is a screen shot of the datawarehouse setup screen for a school’s data warehouse (Item Analysis data table shown):

Looker Studio
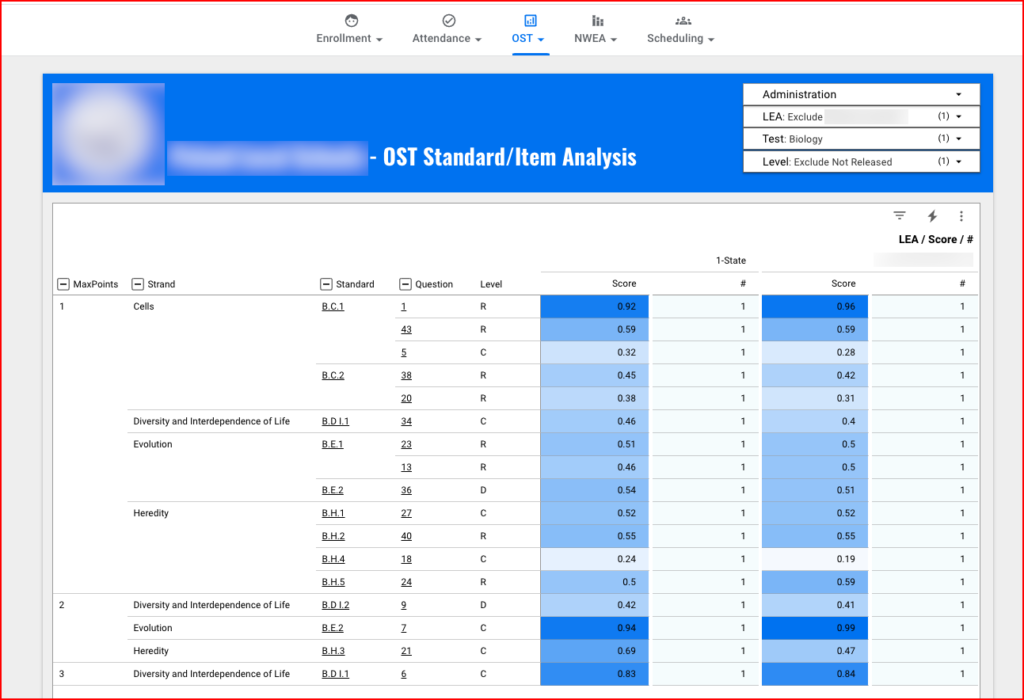
Finally, we can use Looker Studio to create an analytic table to view the data and create a launching point for more in-depth analysis:

As seen above, each Strand, Standard, and Item is included, as well as links to follow for (1) released questions and (2) sample questions from each standard. Included in the data portion of the table is the (1) average score at the State level, (2) average score at the building level, and (3) the number of questions. The Standard and Strand can be collapsed for higher level aggregation analysis.
I’m available this summer to help districts with their OST analysis, or any data analysis and instructional improvement projects.